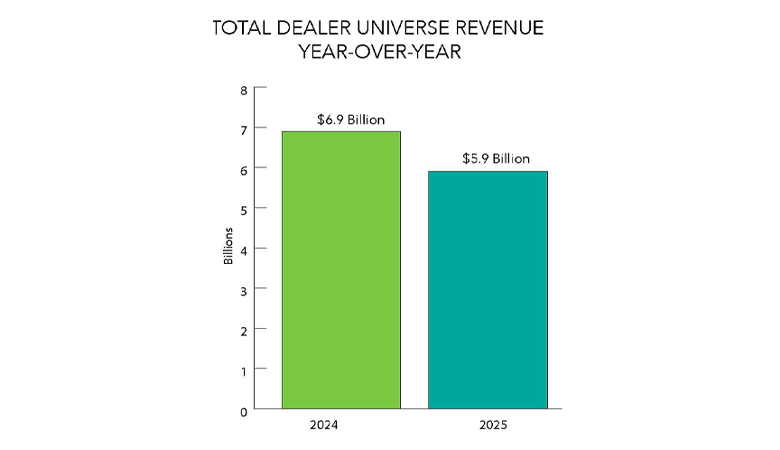
Dealers participating in this year’s survey reported total revenue of $5.9 billion, averaging more than $19.7 million per dealership. Total revenue fell 15% from last year’s $6.9 billion.
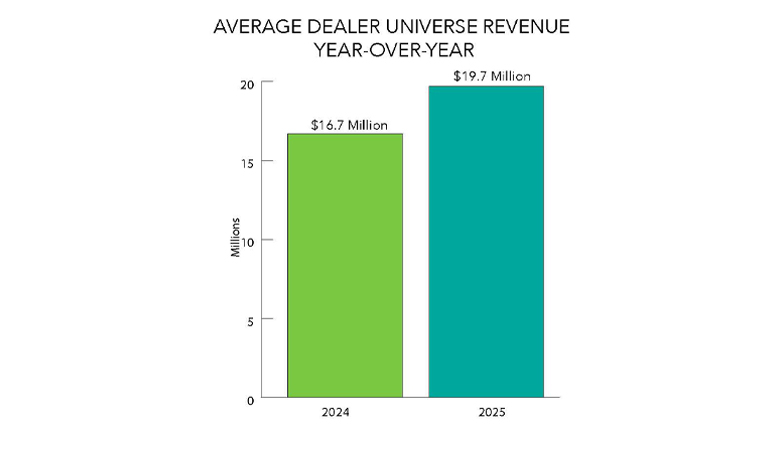
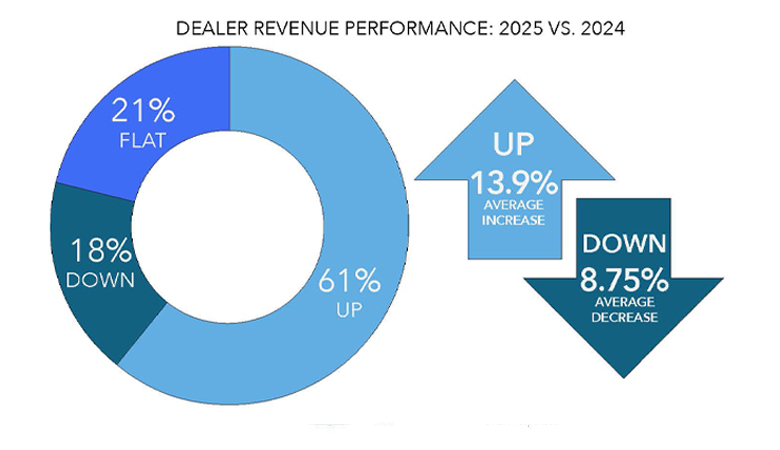
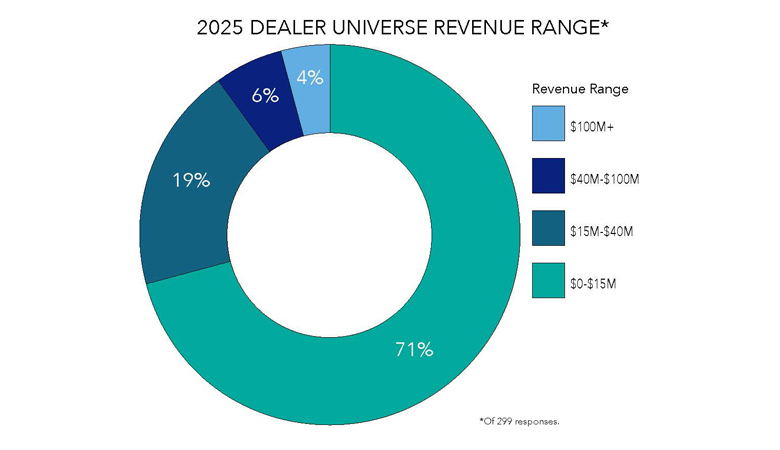
Average revenue increased 18%, or about $3 million, and median revenue rose 27% to $6 million (see the pie chart at top). Dealers with annual revenue below $15 million accounted for 71% of respondents, down from 78%. Those reporting $2 million or less fell from 110 dealers, or 26.5%, to 50, or 16.7%.
Changes in the respondent mix limit direct comparisons of revenue totals and averages. Reported business growth offers a clearer measure of performance: Among dealers whose revenue increased, the median gain was 9%, unchanged from last year.
Revenue remains concentrated among the largest dealers
Eleven dealers with revenue above $100 million represented approximately 4% of respondents but generated 39% of total reported revenue. Combined with the 19 dealers reporting between $40 million and $100 million, these 29 businesses accounted for 10% of respondents and about 60% of revenue.
The concentration was similar last year, when 33 dealers represented 8% of respondents and roughly three-fifths of reported revenue. Fourteen exceeded $100 million and together generated $3.2 billion, nearly half of the $6.9 billion total.
This year’s largest respondent reported $508 million in revenue, followed by one at $380 million. These large dealers have a substantial effect on the average, which is well above the $6 million median. The 90th percentile was above $38 million, while revenue among the smallest tenth of respondents ranged from $218,000 to $1.2 million.
Smaller size does not necessarily indicate poor performance. Many smaller office technology dealerships serve communities and rural markets where they can thrive.
Most office technology dealers reported growth
Of the 293 dealers reporting revenue performance, 179 (61%) grew, 60 (20%) were flat, and 54 (18%) declined. Last year, 67% reported growth, 14% were flat, and 19% declined. The median increase this year was 9%, while the median decrease was 7%.
Results varied by size. No dealer with revenue above $100 million reported a decline, and only one of the 19 dealers in the $40 million to $100 million group did. Among dealers with revenue below $15 million, 21% reported declines.